Page 6 - Digi Notes - Maths -15 April
P. 6
www.mahendraguru.com
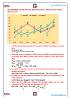
The Following line graph shows the exports from three companies over the years
(Rupees Crore)
Company X Compnay Z Company Y
160
140
140
120 120
120
100 100 100
100 90 90
80 80 80
80 70
60 60 60
60
60 60
40 50
40 40
20 30
0
2009 2010 2011 2012 2013 2014 2015
1. Find the approximate average of the export of all the companies in the year
2014.
+ + ≅ . . .
2. The total export of company X and Z in the years 2015 is approximately what
percentage more than the total export of the company Y and Z in the years
2009.
+ = + =
+ = + =
~
% ↑= × ≅ . %
3. For which of the pairs of years the total exports from the three Companies
together are equal?
( + + = ) ( + + = )
4. In which year was the difference between the exports from Companies X and
Y the minimum?
In 2012 (Just see the gap of X and Y in the graph)
5. What was the difference between the average exports of the three
Companies in 2009 and the average exports in 2012?
( + + )~( + + )
= =
www.mahendraguru.com