Page 7 - Digi Notes - Maths -15 April
P. 7
www.mahendraguru.com
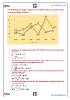
The following line graph shows the ratio of the import to export of two
countries in different years:
3 2.8
2.5
2
2 1.8
1.5 1.25
1.1 1.5
1 0.9 1
0.5 0.75 0.8
0.45 0.45
0
1993 1994 1995 1996 1997 1998
X Y
1. The import of the company X in the year 1995 is Rs.108 Cr.; find the export of the country
in that year
= . → : = :
= × = .
2. The export of the company X in the year 1994 is Rs.190 Cr.; find the difference in the values
of the import and export of the company in that year?
= . → : = :
= × (~) = . .
3. The import of the company Y in the year 1994 is what percent more than the export of the
company in that year?
= . → : = :
~
% ↑= × = %
4. The export of the company X in the year 1995 is what percent less than the import of the
company in that year?
= . → : = :
~
% ↑= × = %
www.mahendraguru.com