Page 5 - Digi Notes - Maths - 25-03-2016
P. 5
www.mahendraguru.com
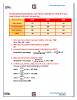
The table given below depicts the result of B.Com students of a college for 3 years.
Study the graph and answer the questions.
Division/Year 2006 2007 2008
First Division 20 30 50
Second Division 60 60 70
Third Division 60 60 60
Failed 30 40 60
1. What was the number of passed students in the year 2008?
+ + =
2. What was the number of third divisions in 2006?
3. How much percent students passed in first division in 2007?
= × = %= 15
(+++)
4. What was the pass percentage in 2008?
(++)
= × = 75%
(+++)
5. In which year, did the college have the best result for B.Com?
The year in which pass percentage is maximum:
→ × ≈ . %
→ × ≈ . %
→ × = %
Hence in the years 2006
www.mahendraguru.com
Page 5 of 11