Page 9 - Digi Notes - Maths - 25-03-2016
P. 9
www.mahendraguru.com
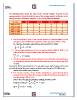
The following table shows the ratio of the average number of males to the
average number of females and the ratio of the average number of literate to the
average number of illiterate people in a city during different decades.
Decades Male Female Literate Illiterate
1960 to 1970 2 3 1 3
1970 to 1980 3 2 4 5
1980 to 1990 4 5 6 7
1990 to 2000 3 4 8 9
2000 to 2010 6 7 10 11
1. Find the respective ratio of the average number of male population to the
average number of illiterate population of the city during 1970 to 1980.
∴ × : × = :
2. If the average population of the city during decade 1960 to 1970 is 6.4
lakhs; find the average number of the literate population?
.
× = .
3. Find the respective ratio of the average number of literate male population
to the average number of literate female population of the city during 2000
to 2010.
.
4. The average number of the female population is approximately what
percent more or less than the average number of the literate population of
the city during 1960 to 1970.
: = × : × = :
% ↑= × = %
www.mahendraguru.com
Page 9 of 11