Page 8 - Digi Notes -Maths - 08 April
P. 8
www.mahendraguru.com
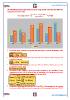
The following column graph shows the percentage profit earned by two different
companies over the years
−
= ( × ) %
55
50
45
40 40
35
30
25 25 25
20
10
2010 2011 2012 2013 2014 2015
A B
1. The income of the company B in the year 2015 is Rs.6250 Cr.; find the expenditure of the
company in that year.
% × % =
2. The expenditure of the company A in the year 2014 is Rs.1250 Cr.; find the income of the
company in that year.
% × % = .
3. The expenditure of the company A in the year 2011 is Rs.4250 Cr.; find the income of the
company B in the year 2014.
4. The income of the company A in the year 2011 is Rs.3240 Cr. The expenditure of the
company B in the year 2014 is 20% more than the expenditure of the company A in the year
2011; then find the income of the company B in the year 2014.
() = × % = . .
%
() = × = .
() = × % = .
%
5. The income of the company B in the year 2010 is Rs.6500 Cr. The expenditure of the company
B in the year 2009 is 10% more than the expenditure of the company B in the year 2010. If
www.mahendraguru.com