Page 12 - Digi Notes - Maths- 01-04-2016
P. 12
www.mahendraguru.com
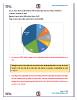
The pie chart shows the distribution of New York market share by volume of different
computer companies in 2005.
Number of units sold in 2005 in New York = 1,500
Value of units sold in 2005 in New York = US $1,650,000
IBM
10%
HP
8%
Commodore
34%
Apple
11%
Tandy
6%
Texas
Others 12%
19%
1. For the year 2005, which company has realised the lowest average unit sales price for a
PC?
Although it seems to be Commodore, the answer cannot be determined due to the fact that we are
unaware of the break-up of the sales value and volume of companies compromising the other
categories.
2. Over the period 2005-2006, if sales (value-wise) of IBM PC's increased by 50% and of Apple
by 15% assuming that PC sales of all the other computer companies remained the same,
by what percentage (approximately) would the PC sales in New York (value-wise) increase
over the same period ?
Page 12 of 16
www.mahendraguru.com