Page 26 - Teacher Preview Copy
P. 26
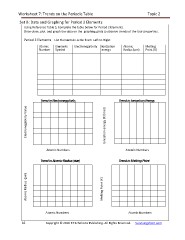
Worksheet 7: Trends on the Periodic Table . Topic 2
Set B: Data and Graphing for Period 2 Elements
Using Reference Table S, Complete the table below for Period 2 Elements.
Once done, plot and graph the data on the graphing grids to observe trends of the four properties.
Period 2 Elements List Elements in order from Left to Right
Atomic Elements Electronegativity Ionization Atomic Melting
Number Symbol energy Radius (pm) Point (K)
Trend in Electronegativity Trend in Ionization Energy
Electronegativity Value Ionization energy (KJ/mol)
Atomic Numbers Atomic Numbers
Trend in Atomic Radius (size) Trend in Melting Point
Atomic Radius (pm)
Melting Point (K)
Atomic Numbers Atomic Numbers
16 Copyright © 2010 E3 Scholastic Publishing. All Rights Reserved. Survivingchem.com