Page 285 - Teacher Preview Copy
P. 285
.
Topic 9 – Kinetics and Equilibrium
9. Continues
6. Given the reaction
XY + energy ----------- > X + Y
Which potential energy diagrams best represents the energy change for this reaction?
XY X + Y XY X + Y
X + Y XY X + Y XY
1) 2) 3) 4)
7. According to Reference Table I, which diagram would correctly represent the potential energy change
Teacher Preview Copy
for the formation of NO(g) from its elements?
2NO N2 +O2 N 2+O 2 2NO
N2 +O2 2NO 2NO N2 +O2
1) 2) 3) 4)
8. According to Reference Table I, which diagram below best shows heat energy change for the
formation of H2O(l) from its elements?
Teacher Preview Copy 2H2O
2H2 +O2
2H2O 2H2+O2 2H2O 2H2+O2
2H2 +O2 2H2O
1) 2) 3) 4)
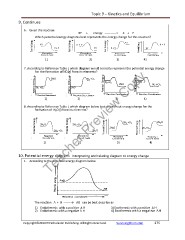
10. Potential energy diagram: Interpreting and relating diagram to energy change
1. According to the potential energy diagram below
The reaction A + B ------- AB can be best describe as
1) Endothermic with a positive ∆ H 3) Exothermic with a positive ∆ H
2) Endothermic with a negative ∆ H 4) Exothermic with a negative ∆H
Copyright©2010 E3 Scholastic Publishing. All Rights Reserved. SurvivingChem.com 275
Topic 9 – Kinetics and Equilibrium
9. Continues
6. Given the reaction
XY + energy ----------- > X + Y
Which potential energy diagrams best represents the energy change for this reaction?
XY X + Y XY X + Y
X + Y XY X + Y XY
1) 2) 3) 4)
7. According to Reference Table I, which diagram would correctly represent the potential energy change
Teacher Preview Copy
for the formation of NO(g) from its elements?
2NO N2 +O2 N 2+O 2 2NO
N2 +O2 2NO 2NO N2 +O2
1) 2) 3) 4)
8. According to Reference Table I, which diagram below best shows heat energy change for the
formation of H2O(l) from its elements?
Teacher Preview Copy 2H2O
2H2 +O2
2H2O 2H2+O2 2H2O 2H2+O2
2H2 +O2 2H2O
1) 2) 3) 4)
10. Potential energy diagram: Interpreting and relating diagram to energy change
1. According to the potential energy diagram below
The reaction A + B ------- AB can be best describe as
1) Endothermic with a positive ∆ H 3) Exothermic with a positive ∆ H
2) Endothermic with a negative ∆ H 4) Exothermic with a negative ∆H
Copyright©2010 E3 Scholastic Publishing. All Rights Reserved. SurvivingChem.com 275