Page 404 - Teacher Preview Copy
P. 404
Constructed Response . Topic 8: Acids, bases and salt
Set I: Graph interpretation, relating pH to hydronium ion concentration, indicator
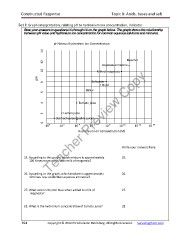
Base your answers to questions 25 through 28 on the graph below. The graph shows the relationship
between pH value and hydronium ion concentration for common aqueous solutions and mixtures.
pH Versus Hydronium Ion Concentration
Bleach •
Aqueous ammonia •
Teacher Preview Copy
Milk of magnesia •
pH
Saltwater •
• Blood
0 2 4 6 8 10 12 14
Milk •
• Tomato juice
• Lemon juice
• Stomach juice (gastric juice)
Teacher Preview Copy
10 10 10 10 10 10 10 10
0
-2
-4
-6
-8
-10
-12
-14
Hydronium Ion Concentration (M)
Write your answers here.
25. According to this graph, which mixture is approximately 25.
100 times more acidic than milk of magnesia?
26. According to the graph, which mixture is approximately 26.
10 times less acidic than aqueous ammonia?
27. What color is thymol blue when added to milk of 27.
magnesia?
28. What is the hydronium concentration of tomato juice? 28.
394 Copyright © 2010 E3 Scholastic Publishing. All Rights Reserved. Survivingchem.com
Set I: Graph interpretation, relating pH to hydronium ion concentration, indicator
Base your answers to questions 25 through 28 on the graph below. The graph shows the relationship
between pH value and hydronium ion concentration for common aqueous solutions and mixtures.
pH Versus Hydronium Ion Concentration
Bleach •
Aqueous ammonia •
Teacher Preview Copy
Milk of magnesia •
pH
Saltwater •
• Blood
0 2 4 6 8 10 12 14
Milk •
• Tomato juice
• Lemon juice
• Stomach juice (gastric juice)
Teacher Preview Copy
10 10 10 10 10 10 10 10
0
-2
-4
-6
-8
-10
-12
-14
Hydronium Ion Concentration (M)
Write your answers here.
25. According to this graph, which mixture is approximately 25.
100 times more acidic than milk of magnesia?
26. According to the graph, which mixture is approximately 26.
10 times less acidic than aqueous ammonia?
27. What color is thymol blue when added to milk of 27.
magnesia?
28. What is the hydronium concentration of tomato juice? 28.
394 Copyright © 2010 E3 Scholastic Publishing. All Rights Reserved. Survivingchem.com