Page 12 - Digi Notes -Maths - 08 April
P. 12
www.mahendraguru.com
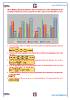
The following column graph shows the percent increase in the population of the
six different cities from year the year 2012 to 2013, 2013 to 2014 and 2014 to 2015.
30 30 30
25 25 25
20 20 20 20
15 15 15
10 10 10
5 5
P Q R S T U
2012 to 2013 2013 to 2014 2014 to 2015
1. If the population of the city P in the year 2015 is 82500 crore; find the population of the city
in the year 2012.
× × × =
2. Find the ratio of the population of the city R in the year 2012 to the population of the city in
the 2015.
: × × × = :
3. Find the overall percentage increase in the population of the city P from year 2012 to 2014.
×
+ + = %
4. Find the percentage increase in the percentage increase in the population of the city R from
the year “2012 to 2013” to “2014 to 2015”.
%~%
% ↑= × = %
%
5. In which city the percentage increase in the population is the maximum from the years 2012
to the years 2013.
6. During which year the percentage increase in the population is the maximum for the city P.
www.mahendraguru.com