Page 15 - Teacher Preview Copy
P. 15
Worksheet 2 . Topic 1
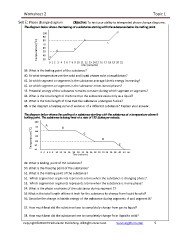
Set E: Phase change diagram Objective: To test your ability to interpreted phase change diagrams.
The diagram below shows the heating of a substance starting with the substance below its melting point.
F
100
90
80 D
70 E
Temperature ( o C) 60 B C
50
40 A
30
0 1 2 3 4 5 6 7 8 9 10 11 12 13 14 15 16 17 18 19 20 21
Time (minutes)
39. What is the boiling point of the substance?
40. At what temperature are the solid and liquid phases exist at equilibrium?
30
41. At which segment or segments is the substance average kinetic energy increasing?
42. At which segment or segments is the substance exists in two phases?
43. Potential energy of the substance remains constant during which segment or segments?
44. What is the total length of the time that the substance exists only as a liquid?
45. What is the total length of time that the substance undergoes fusion?
48. Is the diagram a heating curve of water or of a different substance? Explain your answer.
The diagram below shows the cooling of a substance starting with the substance at a temperature above it
boiling point. The substance is losing heat at a rate of 155 Joules per minute.
200
180 A B
140 C
Temperature ( o C) 120 D
100
80 E
40 0 2 4 6 8 10 12 14 16 18 20 22 24 26 28 30 32 34 36 38 40 42 44
Time (minutes)
49. What is boiling point of the substance?
50. What is the freezing point of the substance?
51. What is the melting point of the substance?
52. Which segment or segments represents a time when the substance is changing phase?
53. Which segment or segments represents a time when the substance is in one phase?
54. What is the phase or phases of the substance during segment C?
55.What is the total length of time it took for the substance to change from liquid to solid?
56. Describe the change in kinetic energy of the substance during segments A and segment B?
57. How much heat did the substance lose to completely change from gas to liquid?
58. How much heat did the substance lose to completely change from liquid to solid?
Copyright©2010 E3 Scholastic Publishing. All Rights Reserved. SurvivingChem.com 5