Page 373 - Teacher Preview Copy
P. 373
Constructed Response . Topic 1: Matter and Energy
Set E : Data interpretation, graphing, phase change diagram, heat calculation.
Base your answers to questions 18 – 22 on the information below.
o
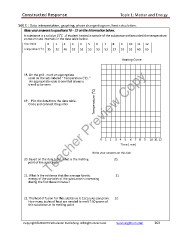
A substance is a solid at 15 C . A student heated a sample of the substance and recorded the temperature
at one-minute intervals in the data table below.
Time (m in) 0 1 2 3 4 5 6 7 8 9 10 11 12
o
Temperature ( C) 15 32 46 53 53 53 53 53 53 53 53 60 65
Heating Curve
18. On the grid , mark an appropriate
o
scale on the axis labeled “ Temperature ( C) .”
An appropriate scale is one that allows a
trend to be seen.
19 . Plot the data from the data table.
Circle and connect the points
Temperature ( o C)
Teacher Preview Copy
Teacher Preview Copy
0 1 2 3 4 5 6 7 8 9 10 11 12
Time ( min)
Write your answers on this side.
20. Based on the data table, what is the melting 20.
point of the substance?
21. What is the evidence that the average kinetic 21.
energy of the particles of the substance is increasing
during the first three minutes?
22. The heat of fusion for this substance is 122 joules per gram. 22.
How many joules of heat are needed to melt 7.50 grams of
this substance at its melting point
Copyright©2010 E3 Scholastic Publishing. All Rights Reserved. SurvivingChem.com 363
Set E : Data interpretation, graphing, phase change diagram, heat calculation.
Base your answers to questions 18 – 22 on the information below.
o
A substance is a solid at 15 C . A student heated a sample of the substance and recorded the temperature
at one-minute intervals in the data table below.
Time (m in) 0 1 2 3 4 5 6 7 8 9 10 11 12
o
Temperature ( C) 15 32 46 53 53 53 53 53 53 53 53 60 65
Heating Curve
18. On the grid , mark an appropriate
o
scale on the axis labeled “ Temperature ( C) .”
An appropriate scale is one that allows a
trend to be seen.
19 . Plot the data from the data table.
Circle and connect the points
Temperature ( o C)
Teacher Preview Copy
Teacher Preview Copy
0 1 2 3 4 5 6 7 8 9 10 11 12
Time ( min)
Write your answers on this side.
20. Based on the data table, what is the melting 20.
point of the substance?
21. What is the evidence that the average kinetic 21.
energy of the particles of the substance is increasing
during the first three minutes?
22. The heat of fusion for this substance is 122 joules per gram. 22.
How many joules of heat are needed to melt 7.50 grams of
this substance at its melting point
Copyright©2010 E3 Scholastic Publishing. All Rights Reserved. SurvivingChem.com 363