Page 6 - Digi Notes -Maths - 08 April
P. 6
www.mahendraguru.com
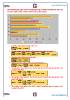
The following bar graph shows the population (in 10,000) of six different cities and
the percentage of the number of the males in these cities:
F 33 65
E 30 42
D 38 50
C 45 60
B 10 25
A 25 45
0 10 20 30 40 50 60 70
%age of Females Popuation
1. Find the number of the females in the city C.
% × % =
2. Find the average of the number of the females in the city A, B, D and F.
% × % + % × % + % × % + % × % =
3. Find the number of the males in the city C.
% × % =
4. How many males are there in the city B and F together?
% × % + % × % =
5. The number of the females in the city B is what % more/less than the number of the
females in the city E?
× %~ × %
% = % % × ≅ %
% × %
6. The number of the females in the city B is what % more/less than the number of the
males in the city E?
× %~ × %
% = % % × ≅ %
% × %
7. The number of the males in the city B is what % more/less than the number of the
females in the city E?
www.mahendraguru.com