Page 136 - Teacher Preview Copy
P. 136
.
Topic 1 – Matter and Energy
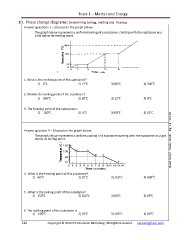
10. Phase change diagrams: Determining boiling, melting and freezing
Answer questions 1 – 3 based on the graph below.
The graph below represents a uniform heating of a substance, starting with the substance as a
solid below its melting point.
1. What is the melting point of this substance? o o
o
o
1) 0 C 2) 12 C 3) 60 C 4) 100 C
2. What is the boiling point of the substance? o o o
o
1) 100 C 2) 60 C 3) 12 C 4) 0 C
3. The freezing point of the substance is o o o
o
1) 100 C 2) 0 C 3) 60 C 4) 12 C
Answer question 4 – 6 based on the graph below.
The graph below represents a uniform cooling of a substance starting with the substance as a gas
above its boiling point.
Need Help? Study Book Pg 13 Set 20
4. What is the freezing point of this substance?
1) 60 C 2) 10 C 3) 150 C 4) 100 C
o
o
o
o
5. What is the boiling point of the substance?
o
o
o
o
1) 150 C 2) 100 C 3) 60 C 4) 10 C
6. The melting point of the substance is
o
o
o
o
1) 100 C 2) 10 C 3) 100 C 4) 60 C
126 Copyright © 2010 E3 Scholastic Publishing. All Rights Reserved. Survivingchem.com
Topic 1 – Matter and Energy
10. Phase change diagrams: Determining boiling, melting and freezing
Answer questions 1 – 3 based on the graph below.
The graph below represents a uniform heating of a substance, starting with the substance as a
solid below its melting point.
1. What is the melting point of this substance? o o
o
o
1) 0 C 2) 12 C 3) 60 C 4) 100 C
2. What is the boiling point of the substance? o o o
o
1) 100 C 2) 60 C 3) 12 C 4) 0 C
3. The freezing point of the substance is o o o
o
1) 100 C 2) 0 C 3) 60 C 4) 12 C
Answer question 4 – 6 based on the graph below.
The graph below represents a uniform cooling of a substance starting with the substance as a gas
above its boiling point.
Need Help? Study Book Pg 13 Set 20
4. What is the freezing point of this substance?
1) 60 C 2) 10 C 3) 150 C 4) 100 C
o
o
o
o
5. What is the boiling point of the substance?
o
o
o
o
1) 150 C 2) 100 C 3) 60 C 4) 10 C
6. The melting point of the substance is
o
o
o
o
1) 100 C 2) 10 C 3) 100 C 4) 60 C
126 Copyright © 2010 E3 Scholastic Publishing. All Rights Reserved. Survivingchem.com