Page 137 - Teacher Preview Copy
P. 137
.
Topic 1 – Matter and Energy
11. Phase change diagrams: Determining phases on the graph
Answer questions 1 – 5 based on the graph below.
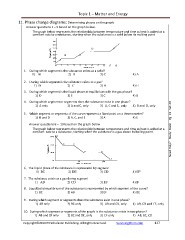
The graph below represents the relationship between temperature and time as heat is added at a
constant rate to a substance, starting when the substance is a solid below its melting point
D E
B C
A
1. During which segment is the substance exists as a solid?
1) B 2) D 3) C 4) A
2. During which segment is the substance exists as a gas?
1) D 2) C 3) A 4) E
3. During which segment is the liquid phase at equilibrium with the gas phase?
1) D 2) E 3) C 4) B
4. During which segment or segments does the substance exist in one phase?
1) A only 2) A and C, only 3) A, C and E, only 4) B and D, only
5. Which segment or segments of the curve represent a fixed point on a thermometer?
1) B and D 2) A, C, and E 3) A 4) E
Answer questions 6 – 10 based on the graph below
The graph below represents the relationship between temperature and time as heat is added at a Need Help? Study Book Pg 13 Set 20
constant rate to a substance, starting when the substance is a gas above its boiling point.
6. The liquid phase of the substance is represented by segment
1) BC 2) DE 3) CD 4) EF
7. The substance exists as a gas during segment
1) AB 2) CD 3) EF 4) B
8. Liquid/solid equilibrium of the substance is represented by which segment of the curve?
1) BC 2) AB 3) EF 4) DE
9. During which segment or segments does the substance exist in one phase?
1) AB only 2) BC only 3) AB and CD, only 4) AB, CD and EF, only
10. During which segment or segments of the graph is the substance exists in two phases?
1) AB and EF only 2) BC and DE, only 3) EF only 4) AB, BC, CD
Copyright©2010 E3 Scholastic Publishing. All Rights Reserved. SurvivingChem.com 127
Topic 1 – Matter and Energy
11. Phase change diagrams: Determining phases on the graph
Answer questions 1 – 5 based on the graph below.
The graph below represents the relationship between temperature and time as heat is added at a
constant rate to a substance, starting when the substance is a solid below its melting point
D E
B C
A
1. During which segment is the substance exists as a solid?
1) B 2) D 3) C 4) A
2. During which segment is the substance exists as a gas?
1) D 2) C 3) A 4) E
3. During which segment is the liquid phase at equilibrium with the gas phase?
1) D 2) E 3) C 4) B
4. During which segment or segments does the substance exist in one phase?
1) A only 2) A and C, only 3) A, C and E, only 4) B and D, only
5. Which segment or segments of the curve represent a fixed point on a thermometer?
1) B and D 2) A, C, and E 3) A 4) E
Answer questions 6 – 10 based on the graph below
The graph below represents the relationship between temperature and time as heat is added at a Need Help? Study Book Pg 13 Set 20
constant rate to a substance, starting when the substance is a gas above its boiling point.
6. The liquid phase of the substance is represented by segment
1) BC 2) DE 3) CD 4) EF
7. The substance exists as a gas during segment
1) AB 2) CD 3) EF 4) B
8. Liquid/solid equilibrium of the substance is represented by which segment of the curve?
1) BC 2) AB 3) EF 4) DE
9. During which segment or segments does the substance exist in one phase?
1) AB only 2) BC only 3) AB and CD, only 4) AB, CD and EF, only
10. During which segment or segments of the graph is the substance exists in two phases?
1) AB and EF only 2) BC and DE, only 3) EF only 4) AB, BC, CD
Copyright©2010 E3 Scholastic Publishing. All Rights Reserved. SurvivingChem.com 127