Page 138 - Teacher Preview Copy
P. 138
.
Topic 1 – Matter and Energy
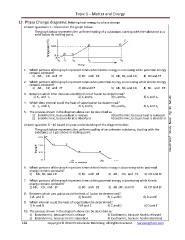
12. Phase Change diagrams: Relating heat energy to phase change
Answer questions 1 – 5 based on the graph below.
The graph below represents the uniform heating of a substance, starting with the substance as a
solid below its melting point.
F
1. Which portions of the graph represent times when kinetic energy is increasing while potential energy
remains constant?
1) AB , CD, and EF 2) BC and DE 3) AB , BC, and CD 4) CD and EF
2. Which portions of the graph represent times when potential energy is increasing while kinetic energy
remains constant? 2) CD and EF 3) AB , BC, and CD 4) BC and DE
1) AB , CD, and EF
3. Between which time intervals could the heat of fusion be determined? 4) t2 and t4
1) to and t1
3) t3 and t4
2) t1 and t2
4. Which time interval could the heat of vaporization be determined? 4) t2 and t4
3) t3 and t4
2) t1 and t2
1) to and t1
5. The process shown in the diagram above can be described as
3) Exothermic, because heat is released
1) Endothermic, because heat is release
2) Endothermic, because heat is absorbed 4) Exothermic, because heat is absorbed
Answer question 6 – 10 based on your understanding of the diagram below:
The graph below represents the uniform cooling of an unknown substance, starting with the Need Help? Study Book Pg 13 Set 20
substance as a gas above its boiling point.
6. Which portions of the graph represent times when kinetic energy is decreasing while potential
energy remains constant? 2) BC and DE 3) AB , CD, and EF 4) CD and EF
1) AB , BC, and CD
7. Which portions of the graph represent times when potential energy is decreasing while kinetic
energy remains constant? 2) BC and DE 3) AB , BC, and CD 4) CD and EF
1) AB , CD, and EF
8. Between which two points could the heat of fusion be determined? 4) D and E
2) B and C
1)A and B
3) C and D
9. Which interval could the heat of vaporization be determined?
1) A and B 2) B and C 3) C and D 4) D and E
10. The process shown in the diagram above can be described as
1) Endothermic, because heat is release 3) Exothermic, because heat is released
2) Endothermic, because heat is absorbed 4) Exothermic, because heat is absorbed
128 Copyright © 2010 E3 Scholastic Publishing. All Rights Reserved. Survivingchem.com
Topic 1 – Matter and Energy
12. Phase Change diagrams: Relating heat energy to phase change
Answer questions 1 – 5 based on the graph below.
The graph below represents the uniform heating of a substance, starting with the substance as a
solid below its melting point.
F
1. Which portions of the graph represent times when kinetic energy is increasing while potential energy
remains constant?
1) AB , CD, and EF 2) BC and DE 3) AB , BC, and CD 4) CD and EF
2. Which portions of the graph represent times when potential energy is increasing while kinetic energy
remains constant? 2) CD and EF 3) AB , BC, and CD 4) BC and DE
1) AB , CD, and EF
3. Between which time intervals could the heat of fusion be determined? 4) t2 and t4
1) to and t1
3) t3 and t4
2) t1 and t2
4. Which time interval could the heat of vaporization be determined? 4) t2 and t4
3) t3 and t4
2) t1 and t2
1) to and t1
5. The process shown in the diagram above can be described as
3) Exothermic, because heat is released
1) Endothermic, because heat is release
2) Endothermic, because heat is absorbed 4) Exothermic, because heat is absorbed
Answer question 6 – 10 based on your understanding of the diagram below:
The graph below represents the uniform cooling of an unknown substance, starting with the Need Help? Study Book Pg 13 Set 20
substance as a gas above its boiling point.
6. Which portions of the graph represent times when kinetic energy is decreasing while potential
energy remains constant? 2) BC and DE 3) AB , CD, and EF 4) CD and EF
1) AB , BC, and CD
7. Which portions of the graph represent times when potential energy is decreasing while kinetic
energy remains constant? 2) BC and DE 3) AB , BC, and CD 4) CD and EF
1) AB , CD, and EF
8. Between which two points could the heat of fusion be determined? 4) D and E
2) B and C
1)A and B
3) C and D
9. Which interval could the heat of vaporization be determined?
1) A and B 2) B and C 3) C and D 4) D and E
10. The process shown in the diagram above can be described as
1) Endothermic, because heat is release 3) Exothermic, because heat is released
2) Endothermic, because heat is absorbed 4) Exothermic, because heat is absorbed
128 Copyright © 2010 E3 Scholastic Publishing. All Rights Reserved. Survivingchem.com