Page 410 - Teacher Preview Copy
P. 410
.
Constructed Response Topic 9 : Kinetic and Equilibrium
Set I: Graphing, factors that affect rate of reaction, collision theory
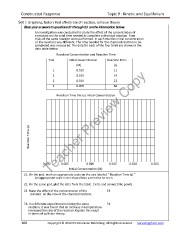
Base your answers to questions 21 through 23 on the information below.
An investigation was conducted to study the effect of the concentration of
a reactant on the total time needed to complete a chemical reaction. Four
trials of the same reaction were performed. In each trial the initial concentration
of the reactant was different. The time needed for the chemical reaction to be
completed was measured. The data for each of the four trials are shown in the
data table below.
Reactant Concentration and Reaction Time
Trial Initial Concentration Reaction Time
(M) (s)
1 0.020 11
Teacher Preview Copy
2 0.015 14
3 0.010 23
4 0.005 58
Reaction Time Versus Initial Concentration
Teacher Preview Copy
Reaction Time (s)
0.000 0.005 0.010 0.015 0.020 0.025
Initial Concentration (M)
21. On the grid, mark an appropriate scale on the axis labeled “ Reaction Time (s).”
An appropriate scale is one that allows a trend to be seen.
22. On the same grid, plot the data from the table. Circle and connect the points .
23. State the effect of the concentration of the 23.
reactant on the rate of the chemical reaction.
24. In a different experiment involving the same 24.
reaction, it was found that an increase in temperature
increased the rate of the reaction. Explain this result
in terms of collision theory.
400 Copyright © 2010 E3 Scholastic Publishing. All Rights Reserved. Survivingchem.com
Constructed Response Topic 9 : Kinetic and Equilibrium
Set I: Graphing, factors that affect rate of reaction, collision theory
Base your answers to questions 21 through 23 on the information below.
An investigation was conducted to study the effect of the concentration of
a reactant on the total time needed to complete a chemical reaction. Four
trials of the same reaction were performed. In each trial the initial concentration
of the reactant was different. The time needed for the chemical reaction to be
completed was measured. The data for each of the four trials are shown in the
data table below.
Reactant Concentration and Reaction Time
Trial Initial Concentration Reaction Time
(M) (s)
1 0.020 11
Teacher Preview Copy
2 0.015 14
3 0.010 23
4 0.005 58
Reaction Time Versus Initial Concentration
Teacher Preview Copy
Reaction Time (s)
0.000 0.005 0.010 0.015 0.020 0.025
Initial Concentration (M)
21. On the grid, mark an appropriate scale on the axis labeled “ Reaction Time (s).”
An appropriate scale is one that allows a trend to be seen.
22. On the same grid, plot the data from the table. Circle and connect the points .
23. State the effect of the concentration of the 23.
reactant on the rate of the chemical reaction.
24. In a different experiment involving the same 24.
reaction, it was found that an increase in temperature
increased the rate of the reaction. Explain this result
in terms of collision theory.
400 Copyright © 2010 E3 Scholastic Publishing. All Rights Reserved. Survivingchem.com